Telehandler Capacity Chart Guide for the United States
Quick Answer

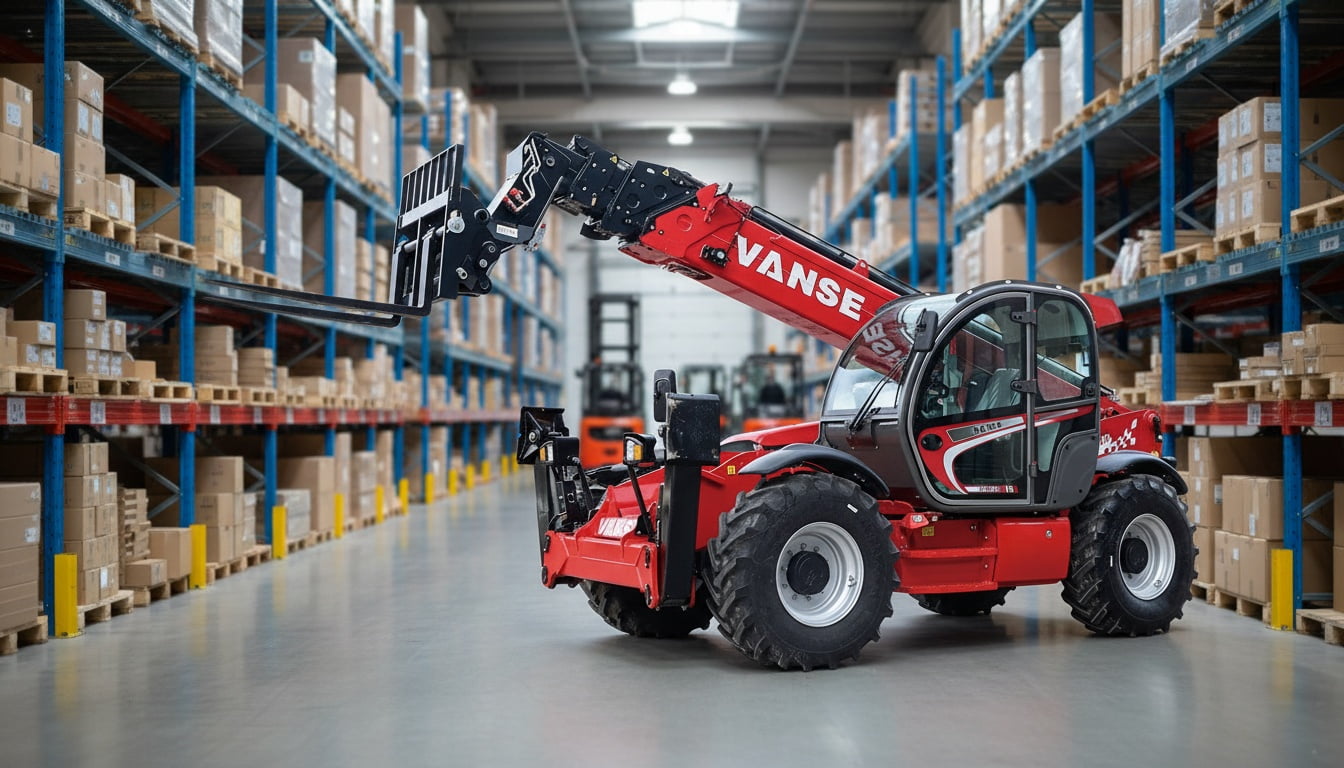
A telehandler capacity chart shows how much weight a telescopic handler can safely lift at specific boom angles, lift heights, and forward reach distances. In the United States, the most practical way to use a telehandler load chart is to match the real jobsite requirement first: compact models usually serve farms, yards, and light construction; 6,000 to 10,000 lb machines cover common commercial building and rental fleet demand; 10,000 lb to 15,000 lb machines fit steel, masonry, energy, and industrial work; and heavy high-reach units are selected for specialized infrastructure and large-site operations. For most buyers, the best local options include JLG, Genie, JCB, Bobcat, SkyTrak, and Manitou because they have broad dealer coverage, strong parts access, and established support in major equipment hubs such as Houston, Dallas-Fort Worth, Chicago, Atlanta, Los Angeles, Miami, and the Inland Empire. Buyers should also consider qualified international suppliers, including Chinese manufacturers with CE and ISO-backed production, premium engine and hydraulic components, and responsive pre-sales and after-sales support, especially when total cost of ownership and price-performance matter.
What a Telehandler Capacity Chart Really Means

A telehandler capacity chart is not a simple single number. The rated capacity printed in a brochure, such as 8,000 lb or 10,000 lb, usually reflects the machine’s maximum lifting ability under a specific condition, often with the boom retracted and the load held close to the chassis. Once the boom extends forward or lifts higher, safe capacity drops. That is why every serious buyer, fleet manager, and operator in the United States needs to read the full lift chart rather than relying only on the headline rating.
On a real jobsite in Phoenix, Houston, Kansas City, or Charlotte, telehandlers are often used for pallets of block, trusses, pipe bundles, HVAC materials, bagged aggregate, hay bales, or oilfield support equipment. Each of these loads has a different center of gravity and different handling behavior. The capacity chart helps the operator understand whether the machine can hold that load at a certain reach and height without exceeding design limits. It also supports OSHA-aligned safe use practices and better fleet planning.
Most telehandler load charts in the United States account for these variables: rated lifting capacity, maximum lift height, maximum forward reach, machine configuration, tire type, stabilizer use if applicable, carriage or attachment selection, and load center. If the attachment changes from forks to a bucket, jib, truss boom, or work platform approved by the manufacturer, the chart changes as well. Capacity therefore depends on the full machine-and-attachment system, not just the base unit.
How to Read a Telehandler Capacity Chart on U.S. Jobsites

When reading a telehandler capacity chart, start with the load weight and its load center. Then confirm the required lift height and horizontal reach. If the machine must place a 6,000 lb pallet onto a third-floor slab edge or a rooftop in Denver or Nashville, the buyer should not assume a 6,000 lb telehandler can perform the task. At higher reach, that machine may have a reduced safe capacity well below the actual load weight.
The safest reading method is practical and simple. First, determine the heaviest load you will routinely move. Second, define the highest placement point. Third, measure how far the machine must reach forward from its front wheels to set the load. Fourth, account for the attachment. Fifth, add a margin for uneven terrain, wind, material variability, and future project demands. This method is especially important for rental fleets that serve mixed applications across metropolitan areas and rural construction corridors.
Typical Telehandler Capacity Classes in the United States
The U.S. market uses telehandlers across construction, agriculture, ports, warehousing, aggregates, and energy. The chart below helps buyers compare common lifting classes and where they usually fit.
| Capacity Class | Typical Lift Height | Typical Reach | Best-Fit Applications | Common U.S. Regions | Buying Notes |
|---|---|---|---|---|---|
| 5,000 to 6,000 lb | 18 to 30 ft | 10 to 18 ft | Small farms, feed yards, landscaping, light commercial work | Iowa, Nebraska, California Central Valley | Good for lower acquisition cost and easier transport |
| 6,000 to 8,000 lb | 36 to 44 ft | 22 to 28 ft | General construction, rental fleets, masonry supply | Texas Triangle, Carolinas, Midwest cities | Most versatile category for mixed job demand |
| 8,000 to 10,000 lb | 44 to 56 ft | 28 to 42 ft | Commercial building, steel erection support, industrial sites | Chicago, Atlanta, Dallas, Phoenix | Popular where lift height and heavier pallets both matter |
| 10,000 to 12,000 lb | 50 to 56 ft | 34 to 42 ft | Infrastructure, precast, oil and gas, utility yards | Houston, Midland, Gulf Coast, Ohio Valley | Requires closer review of axle load and trailer needs |
| 12,000 to 15,000 lb | 55 to 70 ft | 35 to 45 ft | Heavy industrial, bridge, large distribution projects | Port cities, major logistics hubs, mega projects | Higher fuel, tire, and service cost but strong productivity |
| 15,000 lb and above | 56 to 100 ft+ | 40 to 70 ft+ | Specialized infrastructure, refinery shutdowns, mining support | Gulf Coast, Nevada, Appalachia, large civil corridors | Best for specialized fleets with trained operators |
This table matters because the best telehandler capacity chart is the one aligned with daily operating reality. Buyers in urban infill construction around New York or Seattle may prioritize compact dimensions and maneuverability, while contractors near Houston ship channels or inland logistics parks may need higher capacity and longer reach for heavier materials.
U.S. Market Outlook for Telehandlers
The telehandler market in the United States remains supported by nonresidential construction, logistics facility expansion, infrastructure upgrades, agricultural mechanization, and replacement demand in rental fleets. States with sustained demand include Texas, Florida, California, Georgia, North Carolina, Tennessee, Arizona, and Ohio. Telehandlers are especially common where mixed material handling tasks make cranes too specialized and forklifts too limited.
Major equipment corridors near the Port of Houston, Port of Savannah, Port of Los Angeles, Port of Long Beach, and Port Newark benefit from telehandler deployment due to warehouse growth, distribution center construction, and industrial maintenance demand. Inland trade hubs such as Dallas-Fort Worth, Memphis, Louisville, Indianapolis, and Chicago also drive purchases because telehandlers can unload, reposition, and elevate materials efficiently in fast-moving project environments.
The line chart suggests a realistic growth path rather than a dramatic spike. This type of market growth typically supports broader demand for mid-capacity models, more hybrid fleet planning, and increased interest in suppliers that can offer shorter lead times, good financing access, and service support close to key customer clusters.
Product Types and Capacity Chart Differences
Not all telehandlers use the same chart logic in the same way. Fixed boom telehandlers dominate the U.S. market because they are rugged, familiar, and widely supported by dealers and rental houses. Rotating telehandlers have a different value proposition: they can reduce repositioning and improve flexibility on dense urban sites, but they also come with higher purchase cost and more specialized training needs. Compact telehandlers are increasingly relevant in equine operations, nurseries, and indoor or low-clearance industrial work.
| Telehandler Type | Common Capacity Range | Main Advantage | Main Limitation | Typical Buyers | Capacity Chart Focus |
|---|---|---|---|---|---|
| Compact telehandler | 4,000 to 6,000 lb | Fits tighter sites and lower-clearance areas | Lower peak capacity and reach | Farm operators, landscapers, specialty contractors | Stability on uneven ground and attachment use |
| Standard fixed boom | 6,000 to 10,000 lb | Strong balance of cost, reach, and fleet familiarity | Less versatility than rotating units | Rental fleets, general contractors, builders | Reach reduction at mid and high lift positions |
| Heavy fixed boom | 10,000 to 15,000 lb | Handles dense materials and larger pallets | Higher transport and tire costs | Industrial contractors, energy, steel yards | Forward reach under heavy loads |
| High-reach telehandler | 8,000 to 15,000 lb | Places materials at greater heights | Capacity falls quickly at extension | Commercial high-rise support, precast, infrastructure | Upper boom position and rooftop placement |
| Rotating telehandler | 8,000 to 15,000 lb | Crane-like flexibility on constrained sites | Higher complexity and price | Urban contractors, facade specialists | Stabilizer configuration and rotation setup |
| Attachment-focused fleet unit | Varies by base model | One machine for forks, bucket, jib, and more | Chart changes with each approved attachment | Multi-trade contractors, municipalities | Attachment-specific rated load changes |
The explanation behind this table is straightforward: a machine that looks ideal in a brochure can become the wrong choice if its chart does not support the required load at the actual delivery point. Capacity charts vary by machine geometry and intended use, so product type should always be matched to the actual placement task.
Industry Demand by Sector
The United States does not use telehandlers evenly across all industries. General construction remains the largest demand source, but agriculture, logistics, energy, and municipal use all shape fleet composition. Different sectors also prefer different chart profiles. Agricultural buyers may value lower-height repetitive handling with bulky loads, while industrial contractors may prioritize stable higher-capacity lifts on rougher sites.
The bar chart highlights why mid-capacity telehandlers remain so important. Construction and rental together create a large installed base, and those buyers usually need versatile charts that can support many load types across multiple project categories. Agricultural demand also supports compact and lower-cost models with strong low-speed control and reliable hydraulic performance.
Applications Where the Capacity Chart Matters Most
There are some applications where the capacity chart is especially critical. Masonry delivery is one of them because pallet weights are dense and placement zones change as the building rises. Steel and framing support is another because the machine may need to hold long materials that change effective load center. Agricultural bale and feed handling can also challenge stability due to awkward shapes and variable density. Oilfield work around Odessa or the Permian Basin often requires telehandlers to move loads across uneven surfaces, making the safety margin even more important.
In coastal construction markets such as Tampa, Charleston, and Southern California, wind and uneven staging conditions can influence real operating safety even when the chart looks acceptable on paper. In warehouse construction near the Inland Empire or central Pennsylvania, forward reach at slab edge or dock-side set points often determines whether the selected model is truly productive.
Buying Advice for U.S. Buyers
Buyers in the United States should compare telehandler load charts with a practical checklist, not just sticker price. First, review the maximum load that must be placed at the farthest horizontal reach. Second, consider whether the machine will mainly work on stabilized commercial sites, farms, or rough industrial terrain. Third, decide whether dealer support is available within a few hours of the main operating territory. Fourth, compare engine brand, hydraulic system quality, axle durability, and attachment compatibility. Fifth, estimate total ownership cost, including filters, tires, wear parts, transportation, operator training, and downtime exposure.
Lead time also matters. Buyers serving fast-moving projects around Atlanta, Austin, Orlando, and Las Vegas may lose more money from delayed delivery than from a slightly higher machine price. That is why stock availability, domestic warehousing, and parts access should be part of every telehandler capacity chart evaluation. A perfect chart with poor parts support can still be the wrong machine.
| Buying Factor | Why It Matters | Best Question to Ask | Risk if Ignored | Best Fit Buyer | Practical Tip |
|---|---|---|---|---|---|
| Load chart accuracy | Confirms safe lift at height and reach | Can you show the exact chart for my attachment? | Under-spec or unsafe operation | All buyers | Match real pallet weight to exact lift point |
| Dealer and parts network | Reduces downtime | How quickly can common service parts ship? | Long outages during peak season | Rental fleets and contractors | Ask for parts stock lists before purchase |
| Engine and hydraulic brands | Affects reliability and service familiarity | Which components are standard on this model? | Harder maintenance and lower resale confidence | Fleet buyers | Choose globally supported powertrain brands |
| Attachment compatibility | Expands machine utility | Which attachments have approved charts? | Limited jobsite flexibility | Multi-trade users | Confirm forks, bucket, jib, and specialty tools |
| Transport and jobsite access | Impacts deployment cost and route planning | What are machine weight and trailer needs? | Hidden hauling expenses | Regional contractors | Review bridge, trailer, and yard restrictions |
| Warranty and service response | Protects uptime and resale value | Who handles local warranty claims? | Disputes and delayed repairs | First-time buyers | Get written support terms before signing |
This table helps buyers move from brochure comparison to operational decision-making. The most important idea is that the capacity chart should be reviewed alongside support infrastructure and lifecycle cost, especially in the U.S. market where uptime expectations are high.
Case Studies from Common U.S. Use Scenarios
Consider a masonry contractor in Dallas-Fort Worth handling pallets of block and mortar tubs on suburban commercial sites. A 6,000 lb class machine might look sufficient on paper, but if the loads must be placed at second or third floor slab edges with significant forward reach, the contractor may actually need an 8,000 lb class model to maintain safe capacity and productivity. The decision is chart-driven, not marketing-driven.
Now consider a vegetable grower in California’s Central Valley. The operator moves palletized inputs, bin materials, and seasonal loads over mixed yard surfaces. In this case, a compact or mid-size telehandler with lower overall cost and strong visibility may outperform a larger machine. The chart matters, but so do low-speed control, maintenance simplicity, and easy access to service during harvest windows.
For a Gulf Coast industrial maintenance contractor supporting refinery turnarounds, the situation changes again. Higher capacities, longer reach, and reliable parts supply become essential. Here, the telehandler must often perform in tight schedules where downtime costs more than purchase price. The capacity chart determines safe performance, but local support and heavy-duty component quality determine business value.
Trend Shift Toward Versatility and Sustainability
The U.S. market is shifting toward more versatile and lower-emission equipment decisions. Rental companies increasingly prefer machines that serve multiple verticals, while larger contractors are evaluating telematics, fuel efficiency, idle management, and operator-assist systems. By 2026, policy pressure around fleet emissions, urban jobsite noise, and sustainability reporting may encourage more selective buying, especially in states with stricter air-quality expectations.
The area chart illustrates a realistic trend: more buyers are selecting telehandlers not only by capacity chart but also by data visibility, efficiency, safety systems, and long-term compliance value. This shift is especially visible in municipal procurement, larger rental chains, and multi-state contractor fleets.
Local Suppliers and Major Brands in the United States
The supplier landscape in the United States is shaped by dealer coverage, rental presence, financing options, parts availability, and reputation in regional markets. The companies below are real and widely relevant for buyers comparing telehandler capacity chart options.
| Company | Service Regions | Core Strengths | Key Offerings | Typical Buyer | Practical Notes |
|---|---|---|---|---|---|
| JLG Industries | Nationwide, strong in major metro and rental channels | Large installed base, parts support, fleet familiarity | Fixed boom telehandlers, attachments, service support | Rental fleets, contractors, industrial users | Often shortlisted for broad U.S. support coverage |
| Genie | Nationwide through dealer and equipment networks | Established reputation and common fleet adoption | Telehandlers across common capacity classes | Commercial construction and rental buyers | Strong fit for standard fleet replacement cycles |
| JCB | Wide U.S. presence, strong dealer footprint in many states | Global brand recognition and broad machine portfolio | Construction and agricultural telehandlers | Mixed-use buyers and dealers | Appeals to buyers seeking multiproduct supplier relationships |
| Bobcat | Nationwide, especially strong through compact equipment channels | Dealer familiarity and compact equipment crossover | Telehandlers for construction and farm use | Existing Bobcat customers, small contractors, farms | Good option when one dealer supports multiple equipment classes |
| SkyTrak | Very strong recognition across the U.S. construction market | Jobsite familiarity and simple fixed-boom demand | Construction telehandlers and support parts | General contractors and rental fleets | Well known on commercial sites and masonry work |
| Manitou | Nationwide with strong agriculture and construction relevance | Diverse telehandler lineup and application flexibility | Agricultural, construction, and specialty models | Farms, dealers, industrial yards | Useful where multi-application fleets are common |
The explanation here is practical: these suppliers matter because capacity chart quality alone does not win the U.S. market. Buyers also need local technicians, replacement parts, finance channels, and operators who already know the equipment style. In many states, especially Texas, Florida, Georgia, Ohio, and California, service density is often a deciding factor.
Supplier Comparison by Common Buyer Priorities
This comparison chart reflects a common buying reality in the United States. Established domestic and entrenched global brands usually lead in dealer density and rental familiarity, while qualified international value suppliers can be highly competitive on price-performance, customization, and procurement flexibility. For buyers with disciplined maintenance teams and clear import or local warehousing arrangements, the second category can be especially compelling.
How Qualified International Suppliers Fit the U.S. Market
U.S. buyers increasingly evaluate international telehandler suppliers when domestic pricing, lead times, or OEM customization options become restrictive. This is particularly relevant for distributor groups, regional rental firms, private-label equipment businesses, and enterprise buyers that want model differentiation. The key is to work only with suppliers that provide transparent capacity charts, recognized component sourcing, documented testing, and real service commitments inside the U.S. market.
When an international supplier supports local inventory, responds quickly on parts claims, and can provide technical documentation suitable for the U.S. market, it becomes far easier for buyers to justify the purchase. Coastal gateways such as Los Angeles, Savannah, Houston, and Newark are central to this supply model, but inland stocking closer to customer clusters is becoming more important as fleet owners seek faster turnaround and less port-related uncertainty.
Our Company
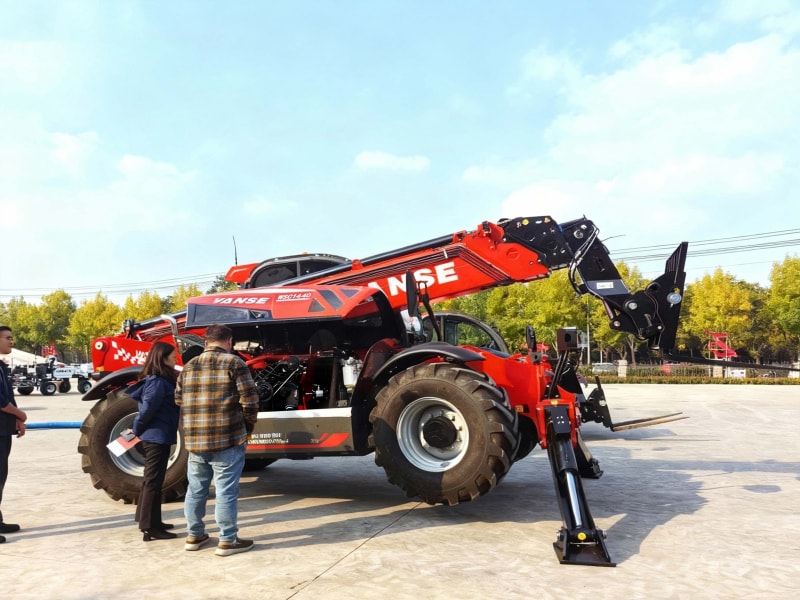
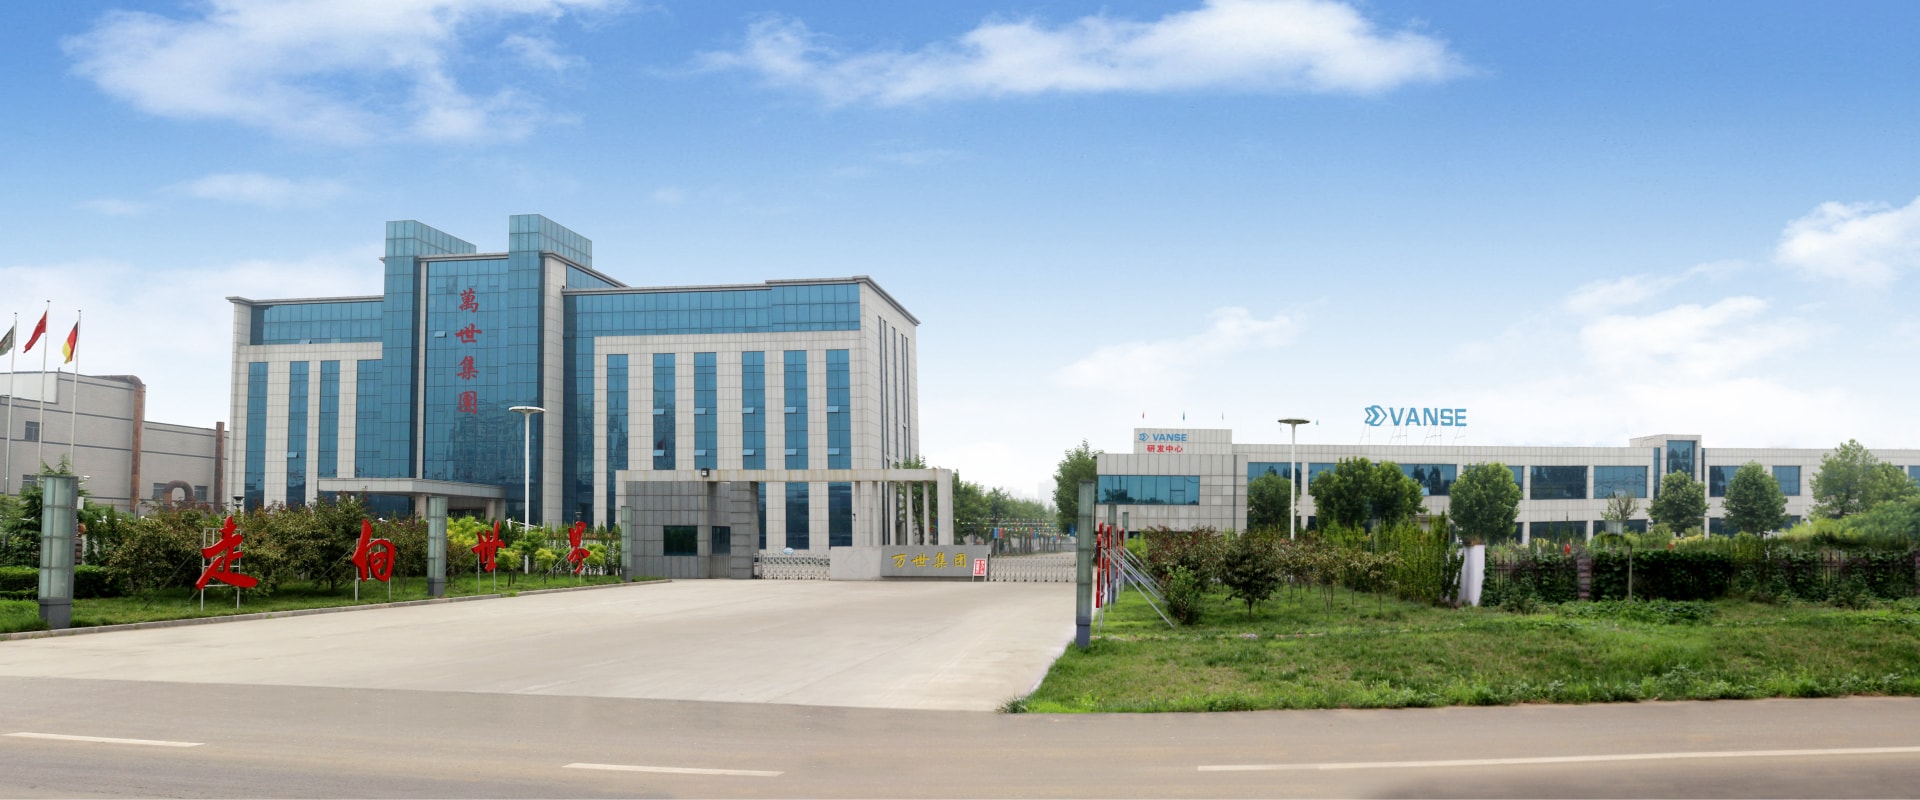
As a telehandler-focused manufacturer serving the United States market, VANSE Group combines measurable product evidence with local market commitment. Founded in 2013 and headquartered in Jining, the company has produced more than 8,000 machines and supplies customers in over 40 countries, including North America, under CE and ISO 9001 certified processes. Its telehandlers use globally recognized core components such as Perkins and Cummins engines together with premium hydraulic systems, transmissions, and axles, and every unit undergoes comprehensive load testing, safety inspection, and performance validation before shipment, which is exactly the type of proof U.S. buyers expect when comparing a telehandler capacity chart against established brands. Beyond product quality, VANSE supports multiple cooperation models for end users, distributors, dealers, brand owners, rental businesses, and individual buyers through OEM, ODM, wholesale, retail, and regional partnership arrangements, making it suitable for both fleet expansion and private-label development. The company is also actively establishing a U.S.-based subsidiary with local inventory and after-sales capability to serve North American customers more directly, backed by online technical support and offline service coordination that protect uptime and reduce the risk commonly associated with remote-only exporters. Buyers exploring telehandler equipment options can review the company background on the company page, evaluate lifecycle support through its service resources, and start a direct project discussion through the U.S. inquiry channel.
What Industries Benefit Most from the Right Load Chart
Construction remains the largest segment, but several industries gain significant value when telehandler capacity charts are matched correctly to operations. Agriculture benefits because many loads are bulky, repetitive, and time-sensitive. Manufacturing and industrial yards benefit because they need flexible movement of components, containers, and maintenance materials without relying on fixed lifting equipment for every task. Mining and aggregate operations use telehandlers for support handling in maintenance zones and staging areas. Oil and gas sites value telehandlers for variable terrain and changing material flows. Municipal departments and utilities use them where one machine must cover many support tasks throughout the year.
In all of these industries, matching the chart to the actual application reduces risk, improves productivity, and protects machine life. A machine that is frequently operated at the edge of its chart will create more downtime and operator stress than one selected with appropriate margin.
Common Mistakes When Comparing Load Charts
The first common mistake is comparing only maximum rated capacity. The second is ignoring attachment-specific chart reductions. The third is overlooking load center and material shape. The fourth is underestimating site conditions, especially mud, uneven grades, wind, and congestion. The fifth is buying too close to today’s need with no margin for next year’s projects. These errors are common among first-time buyers and even among growing regional fleets that move too quickly on price alone.
A more reliable method is to collect representative loads from recent projects, identify three to five repeat tasks, and map those tasks against actual manufacturer charts. That process usually reveals whether a compact, standard, heavy, or high-reach model is the right investment.
Future Trends for 2026
Looking toward 2026, the U.S. telehandler market is likely to be shaped by three major forces: technology adoption, policy pressure, and sustainability expectations. On the technology side, more telehandlers will include telematics, remote diagnostics, geofencing, operator monitoring, camera-assisted visibility, and smarter load management features. On the policy side, public procurement and urban construction standards will put more attention on emissions, safety documentation, and site reporting. On the sustainability side, contractors and rental fleets will increasingly track idle time, fuel burn, maintenance efficiency, and fleet utilization because these metrics affect both ESG reporting and project profitability.
For buyers, this means the telehandler capacity chart remains foundational, but it is no longer the only decision document. Future-ready purchasing will combine load chart suitability with data integration, service responsiveness, lower emissions strategies, and supplier stability. Telehandlers that can prove both lifting performance and lifecycle accountability will win more fleet placements.
FAQ
What is the difference between rated capacity and actual working capacity?
Rated capacity is the maximum value under specified conditions, often with the boom retracted. Actual working capacity depends on lift height, forward reach, attachment, and load center.
Can I use one capacity chart for all attachments?
No. Forks, buckets, jibs, and other approved attachments can change the machine’s balance and safe lifting limits. Always use the chart for the exact configuration.
Which telehandler size is most common in the United States?
The 6,000 to 10,000 lb class is the most broadly useful because it serves general construction, rental fleets, and many mixed-use applications.
Why does capacity drop so much when the boom extends?
As the load moves farther from the machine, leverage increases and stability margin decreases. That is why forward reach has such a major effect on safe lifting capacity.
Are imported telehandlers worth considering in the U.S. market?
Yes, if the supplier provides documented testing, quality certifications, globally recognized components, clear capacity charts, and real U.S. service support. They can offer strong cost-performance value.
How important is local dealer support?
It is extremely important. Even an excellent machine becomes expensive if parts delays or weak service support create avoidable downtime during peak operating periods.
What should rental fleets prioritize when comparing charts?
Rental fleets should prioritize broad application coverage, easy operator understanding, attachment flexibility, durable components, and strong parts availability in their operating region.
What should I prepare before asking for a quote?
Prepare your heaviest routine load, highest placement point, farthest forward reach, preferred attachments, jobsite conditions, transport limits, and primary operating state or city.
Final Takeaway
The best telehandler capacity chart for the United States is the one that accurately matches the load, reach, height, attachment, and support conditions of your actual operation. In practice, that usually means selecting a machine with enough reserve capacity for real-world jobsite variability, backed by a supplier with dependable parts, documentation, and service. Whether you buy from a major established U.S. brand or a qualified international manufacturer with proven certifications, premium component sourcing, and local support commitment, the right decision starts with the chart and ends with uptime in the field.
Complete Telescopic Handler Equipment Portfolio
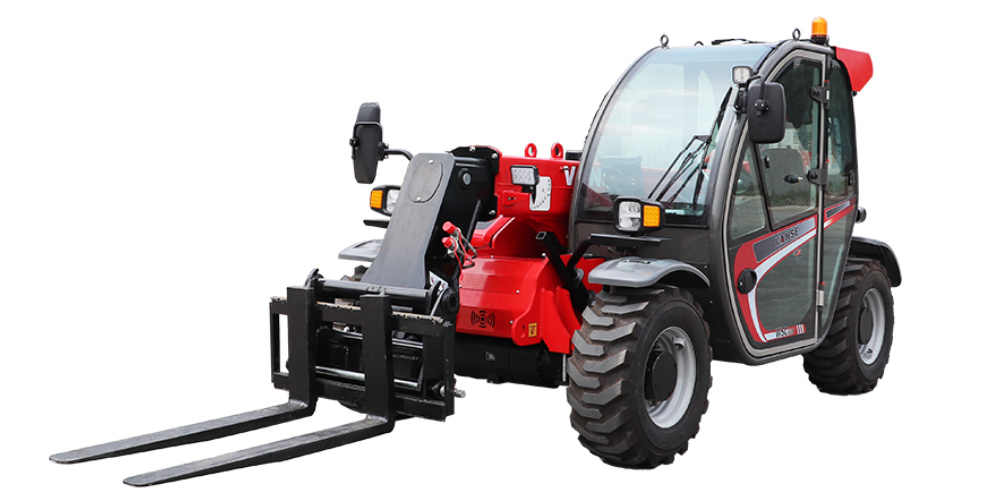
VANSE 625 6m Telescopic Handler
Designed for efficient material handling and stacking in warehouses, factories, and confined job sites, offering compact maneuverability and reliable performance.

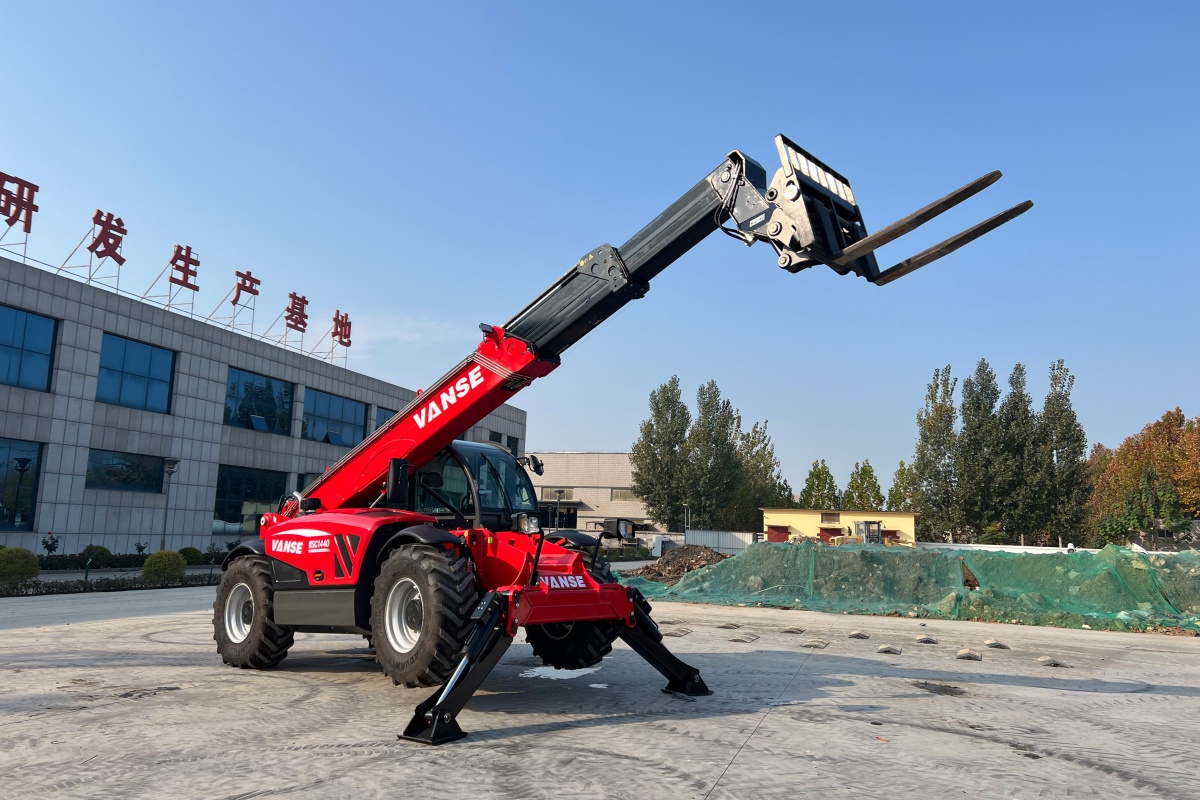
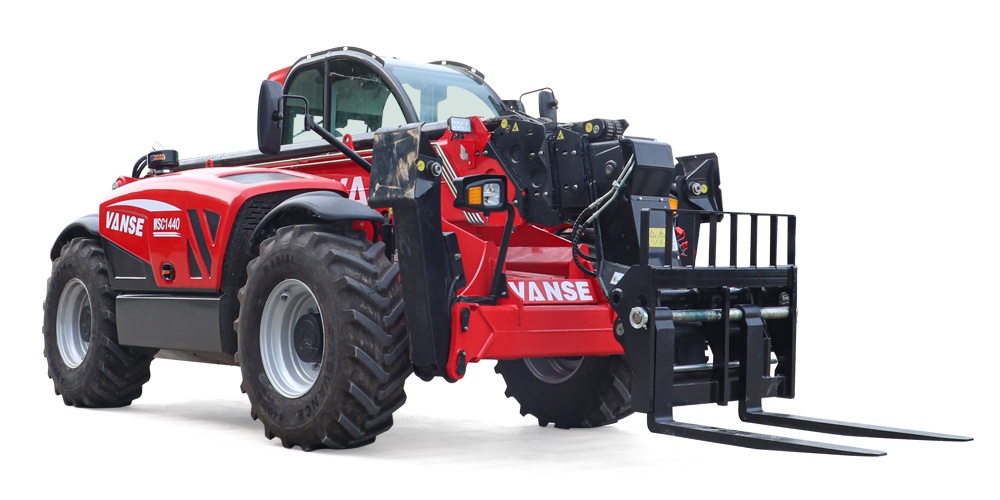
VANSE 735 7m Telescopic Handler
A balanced mid-duty solution for construction, agriculture, logistics, and warehousing, combining stable lifting, strong traction, and everyday versatility.


About the Author:
The VANSE team is a group of experienced professionals specializing in construction machinery research, manufacturing, and technical support. With deep industry knowledge and hands-on experience, our engineers and product specialists share practical insights on equipment selection, operation, maintenance, and industry trends.
Share
You May Also Interest
-

April 2, 2026
Telehandler for Framing: Structure Guide
Discover telehandler for framing options in the United States, including suppliers, jobsite uses, buying tips, and service support for builders.
-

April 1, 2026
Telehandler vs Truck Mounted Crane
Compare telehandler vs truck mounted crane in the United States with costs, applications, suppliers, service coverage, and 2026 buying trends.
-

March 31, 2026
Telehandler Forklift: Specs & Uses
Explore telehandler forklift options in the United States, including specs, uses, suppliers, buying tips, service support, and 2026 market trends.
-

March 30, 2026
Telehandler for Farming: Productivity
Find the best telehandler for farming in the United States with supplier comparisons, farm applications, buying tips, and service insights for 2026 planning.